Exploring Your Data with Plotting and Visualization Tools
What is Matplotlib?
Matplotlib is a low-level graph-plotting library in Python that serves as a visualization utility.
Installation of Matplotlib
If you have Python and PIP already installed on a system, then installation of Matplotlib is very easy. Install it using this command:
pip install matplotlib
Once Matplotlib is installed, import it in your applications by adding the import matplotlibstatement. To check the version, the version string is stored under the__version__ attribute.
import matplotlib

print(matplotlib.__version__)

output:
 2.0.0
Matplotlib Pyplot
Most of the Matplotlib utilities lies under the submodule pyplotand are usually imported under the alias:pltimport matplotlib.pyplot as plt
Example: Draw a line in a diagram from position (0,0) to position (6,250).
import matplotlib.pyplot as plt
import numpy as np

xpoints = np.array([0, 6])
ypoints = np.array([0, 250])

plt.plot(xpoints, ypoints)
plt.show()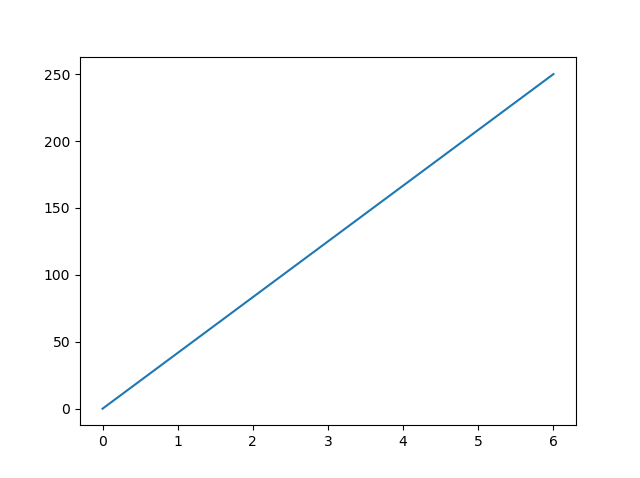
You can use the keyword argument marker to emphasize each point with a specified marker. plt.plot(xpoints,ypoin,marker='o') Also, you can use the keyword argumentlinestyle, or shorterls, to change the style of the plotted line plt.plot(xpoints,ypoin,marker='o',ls='dotted').
Matplotlib Labels and Title
With Pyplot, you can use the xlabel() and ylabel() functions to set a label for the x- and y-axis. You can also use the title() function to set a title for the plot.
import numpy as np
import matplotlib.pyplot as plt

x = np.array([80, 85, 90, 95, 100, 105, 110, 115, 120, 125])
y = np.array([240, 250, 260, 270, 280, 290, 300, 310, 320, 330])

plt.title("Housing Price")
plt.xlabel("Size(ft)")
plt.ylabel("Price($)")

plt.plot(x, y, marker= 'o',color='red')
plt.show()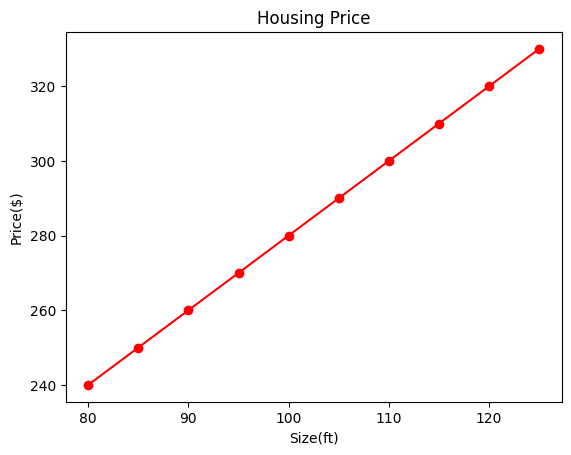
With Pyplot, you can use the grid() function to add grid lines to the plot.
Matplotlib Subplots
With the subplots() function you can draw multiple plots in one figure:
example: Draw to 2 plot with title
import matplotlib.pyplot as plt
import numpy as np

#plot 1:
x=np.arange(0,3*np.pi,0.1)
y=np.sin(x)

plt.subplot(1, 2, 1)
plt.plot(x,y)
plt.title("SIN WAVE")

#plot 2:
x=np.arange(0,3*np.pi,0.1)
y=np.cos(x)

plt.subplot(1, 2, 2)
plt.plot(x,y)
plt.title("COS WAVE")

plt.show()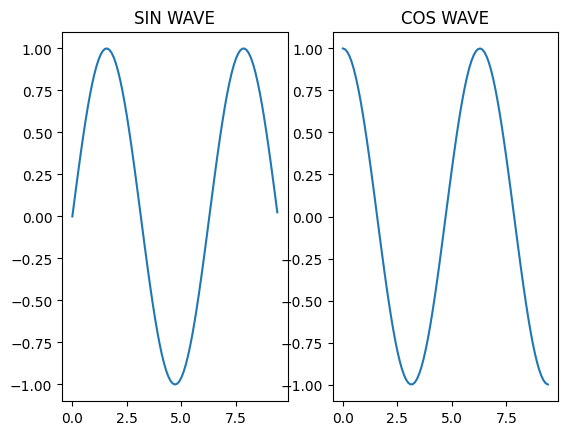
Creating Scatter Plots
With Pyplot, you can use the scatter() function to draw a scatter plot. The scatter() function plots one dot for each observation. It needs two arrays of the same length, one for the values of the x-axis, and one for values on the y-axis:
import matplotlib.pyplot as plt
import numpy as np

x = np.array([5,7,8,7,2,17,2,9,4,11,12,9,6])
y = np.array([99,86,87,88,111,86,103,87,94,78,77,85,86])

plt.scatter(x, y)
plt.show()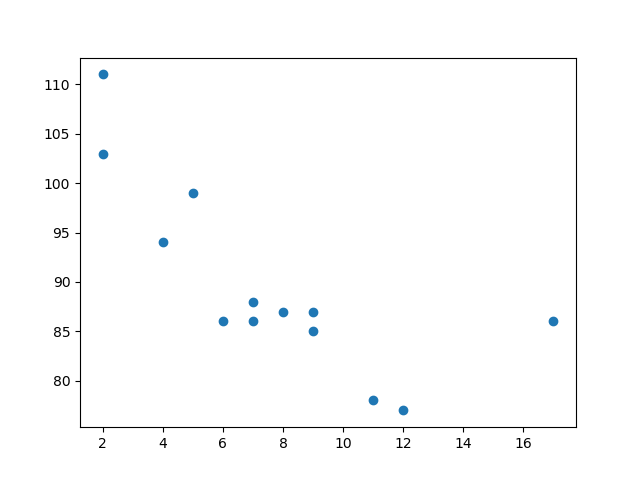
The Matplotlib module has a number of available colormaps. A colormap is like a list of colors, where each color has a value that ranges from 0 to 100.
Matplotlib Bars
With Pyplot, you can use the bar() function to draw bar graphs: example
import matplotlib.pyplot as plt
import numpy as np

x = np.array(["A", "B", "C", "D"])
y = np.array([3, 8, 1, 10])

plt.bar(x,y)
plt.show()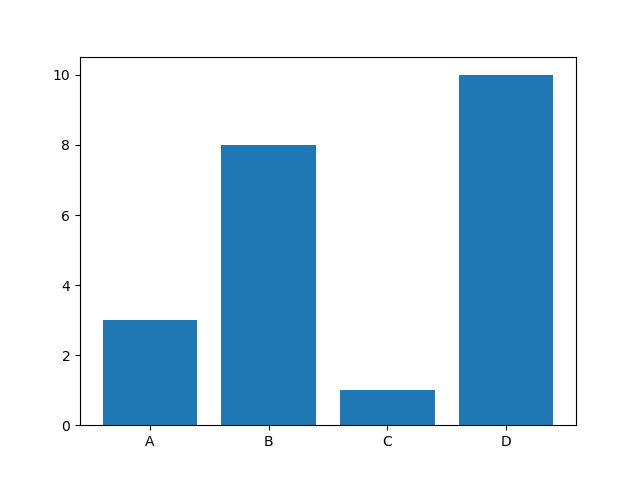
Matplotlib Histograms
In Matplotlib, we use the hist() function to create histograms. The hist() function will use an array of numbers to create a histogram, the array is sent into the function as an argument.
import matplotlib.pyplot as plt
import numpy as np

x = np.random.normal(170, 10, 250)

plt.hist(x)
plt.show() 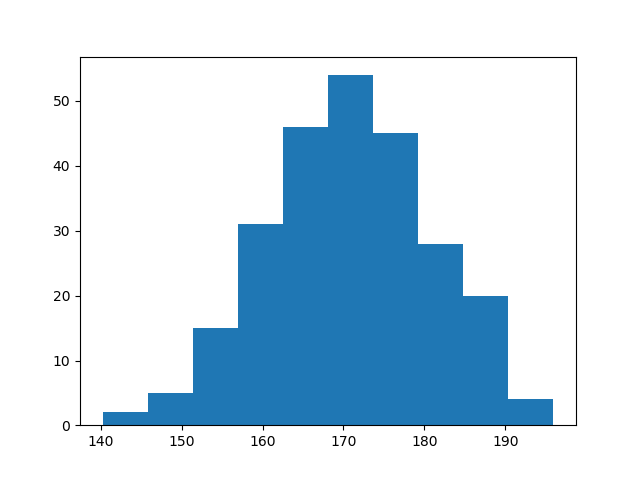
Creating Pie Charts
With Pyplot, you can use the pie() function to draw pie charts example
import matplotlib.pyplot as plt
import numpy as np

y = np.array([35, 25, 25, 15])
mylabels = ["Apples", "Bananas", "Cherries", "Dates"]

plt.pie(y, labels = mylabels)
plt.legend(title = "Four Fruits:")
plt.show() 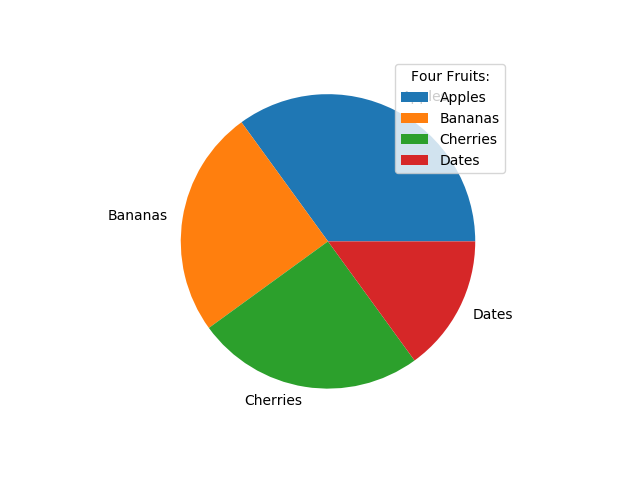
Conclusion
matplotlib is an excellent library for exploratory data analysis and publication quality plotting. It’s won its popularity by offering an easy-to-use procedural interface through a pyplot state machine. At the same time, it also allows to control all aspects of plotting for advanced visualizations through its main object-oriented interface, which facilitates the creation of maintainable, modular code.


No comments yet.
Leave a Comment